

Organizations generate vast amounts of data from various sources, including customer interactions, sales transactions, website activity, etc. Businesses need sophisticated tools to translate raw data into meaningful insights to make sense of this wealth of information. This article will delve into MongoDB Charts and explore its vital role in empowering modern organizations with powerful data visualization capabilities.
What are MongoDB Charts?
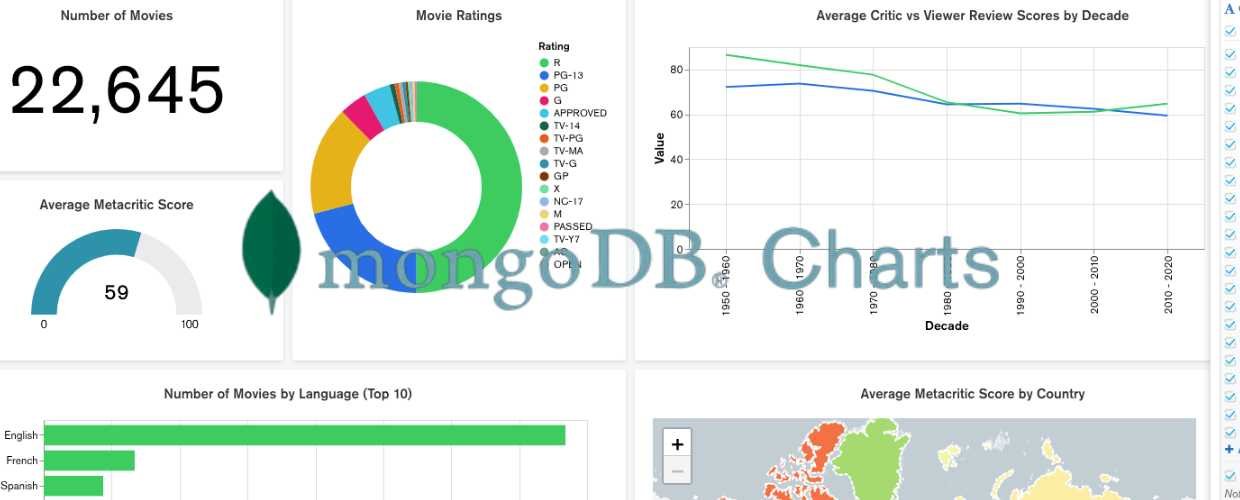
MongoDB Charts is a powerful data visualization tool designed to work seamlessly with MongoDB, a leading NoSQL database. It allows users to transform raw data from MongoDB collections into interactive and visually appealing charts, graphs, and dashboards without complex coding or external integrations. This tool empowers businesses and developers to gain deeper insights from their data and make informed decisions.
With MongoDB Charts, users can easily create visualizations, including bar charts, line graphs, pie charts, heat maps, and scatter plots. The intuitive drag-and-drop interface enables effortless data manipulation, as users can choose fields, apply filters, and group data to customize visualizations to their specific needs. The tool’s real-time chart updates ensure that users constantly work with the most current data.
Creating interactive dashboards is another valuable feature of MongoDB Charts. Users can consolidate multiple charts into a dashboard to monitor key metrics, explore different data perspectives, and discover real-time trends. These dashboards can be shared with team members or stakeholders, promoting collaborative data-driven decision-making. Moreover, MongoDB Charts offers robust security features, ensuring that data visualizations are accessible only to authorized individuals and protecting sensitive information.
Key Features and Capabilities of MongoDB Charts
MongoDB Charts has many features and capabilities that simplify the data visualization process. Let’s explore some of the key components of this versatile tool.
Seamless Data Connectivity
One of the standout features of MongoDB Charts is its seamless connection to MongoDB databases. Users can directly access and visualize data from their collections without complex data extraction or transformation processes. This native integration streamlines the data visualization pipeline and significantly reduces the time and effort required to present valuable insights.
Intuitive Chart Creation
It boasts a user-friendly interface that enables users to create compelling visualizations easily. Users can choose from various chart types, including bar charts, line charts, pie charts, and scatter plots. Furthermore, the platform offers a range of customization options, allowing users to fine-tune chart styles, colors, labels, and other visual elements to suit their specific needs and preferences.
Dashboard Creation and Sharing
MongoDB Charts enables users to create interactive dashboards by combining multiple charts into a single view to view data trends and patterns comprehensively. These dashboards can be customized to present a holistic overview of data insights, making it easier for stakeholders to derive insights at a glance. Moreover, users can effortlessly share these dashboards with colleagues or external stakeholders, fostering collaboration and facilitating data-driven decision-making across the organization.
Embedding Capabilities
It supports embedding charts and dashboards into third-party applications or internal portals. This functionality enables organizations to extend data visualization capabilities to customers, partners, or team members without requiring them to access the MongoDB Charts platform directly. Embedding charts into existing applications allows organizations to provide seamless and contextual access to data insights, enhancing user experiences and driving engagement.
Data Access Controls
Data security and access control are paramount when dealing with sensitive information. MongoDB Charts incorporates robust data access controls, ensuring only authorized users can view specific charts or dashboards. Organizations can set up role-based access to data, protecting sensitive information and maintaining data privacy and security.
Support for Real-Time Data
In today’s fast-paced business environment, visualizing real-time data is critical. MongoDB Charts excels in rendering real-time data visualizations, whether tracking website traffic, monitoring sensor data, or analyzing user interactions. Organizations can instantly identify trends and react promptly to changing conditions, facilitating proactive decision-making.
Benefits of MongoDB Charts
MongoDB Charts offers several benefits that are instrumental in helping organizations leverage their data effectively. Let’s explore some key advantages.
Enhanced Data Understanding
Data visualization is a powerful tool for simplifying complex datasets. MongoDB Charts empowers users to understand data patterns and relationships more intuitively. Interactive charts and graphs enable users to drill down into specific data points, uncovering insights and correlations that might have otherwise gone unnoticed.
Data-Driven Decision-Making
Data-driven decision-making is at the core of successful organizations. MongoDB Charts facilitates this process by providing a visually engaging platform to explore and analyze data. When stakeholders can access and interpret data effortlessly, they are more likely to make informed decisions that lead to improved business outcomes.
Time-Efficient Data Visualization
Time is a valuable resource, especially in a competitive business landscape. MongoDB Charts streamlines the data visualization process, allowing users to create impactful visualizations quickly and efficiently. By reducing the time spent on data preparation, users can focus more on analyzing insights and acting upon them promptly.
Increased Data Accessibility
Data accessibility is essential for fostering a data-driven culture within an organization. MongoDB Charts’ easy-to-share dashboards and embedded charts make data insights accessible to a wider audience, promoting collaboration and knowledge sharing. Whether it’s executives, analysts, or frontline employees, everyone can benefit from the power of data visualization.
Flexibility and Customization
Every organization has unique data requirements and branding guidelines. MongoDB Charts’ flexibility and customization options allow users to tailor visualizations to match their needs and align with their brand identity. This personalization level enhances visualizations’ impact and reinforces the organization’s identity across data presentations.
Integration with Existing Systems
Integrating MongoDB Charts with existing applications, databases, and analytics tools is seamless. This compatibility enables organizations to augment their tech stack with powerful data visualization capabilities without significant disruptions. As a result, organizations can leverage their existing infrastructure investments while enhancing their data analytics capabilities.
Conclusion
In the digital age, data visualization has become essential for organizations seeking to thrive in a data-driven world. MongoDB Charts is a valuable asset, providing organizations with a robust platform to transform raw data into actionable insights. With its seamless data connectivity, intuitive chart creation, interactive dashboards, and real-time data support, MongoDB Charts empowers organizations to communicate complex data insights effectively. By embracing the platform, organizations can unlock the full potential of their data, driving innovation and propelling growth in an increasingly data-centric landscape. From empowering data-driven decision-making to fostering collaboration and accessibility, MongoDB Charts stands at the forefront of modern data visualization solutions.